
Up to date analytics and KPIs
Try our demo
Explore the Röhlig Insights dashboard. No sign-up required.
Comprehensive data information
Keep a real-time overview of your past, current and future shipment data including depature, arrival, pick up and delivery milestones. View your air, sea and road shipments together or separately.
Detailed analysis and reporting
Simplify your analysis and filter by shipment type, consignee or carrier. View and export raw data covering a variety of insights including transit time analysis, trade lane summaries, and 3 years of historical data.
Enhanced sustainibility tracking
Make informed decisions based on your carbon footprint. Measure CO2 emissions for each shipment segment (pick up, main leg, delivery) and the overall journey.
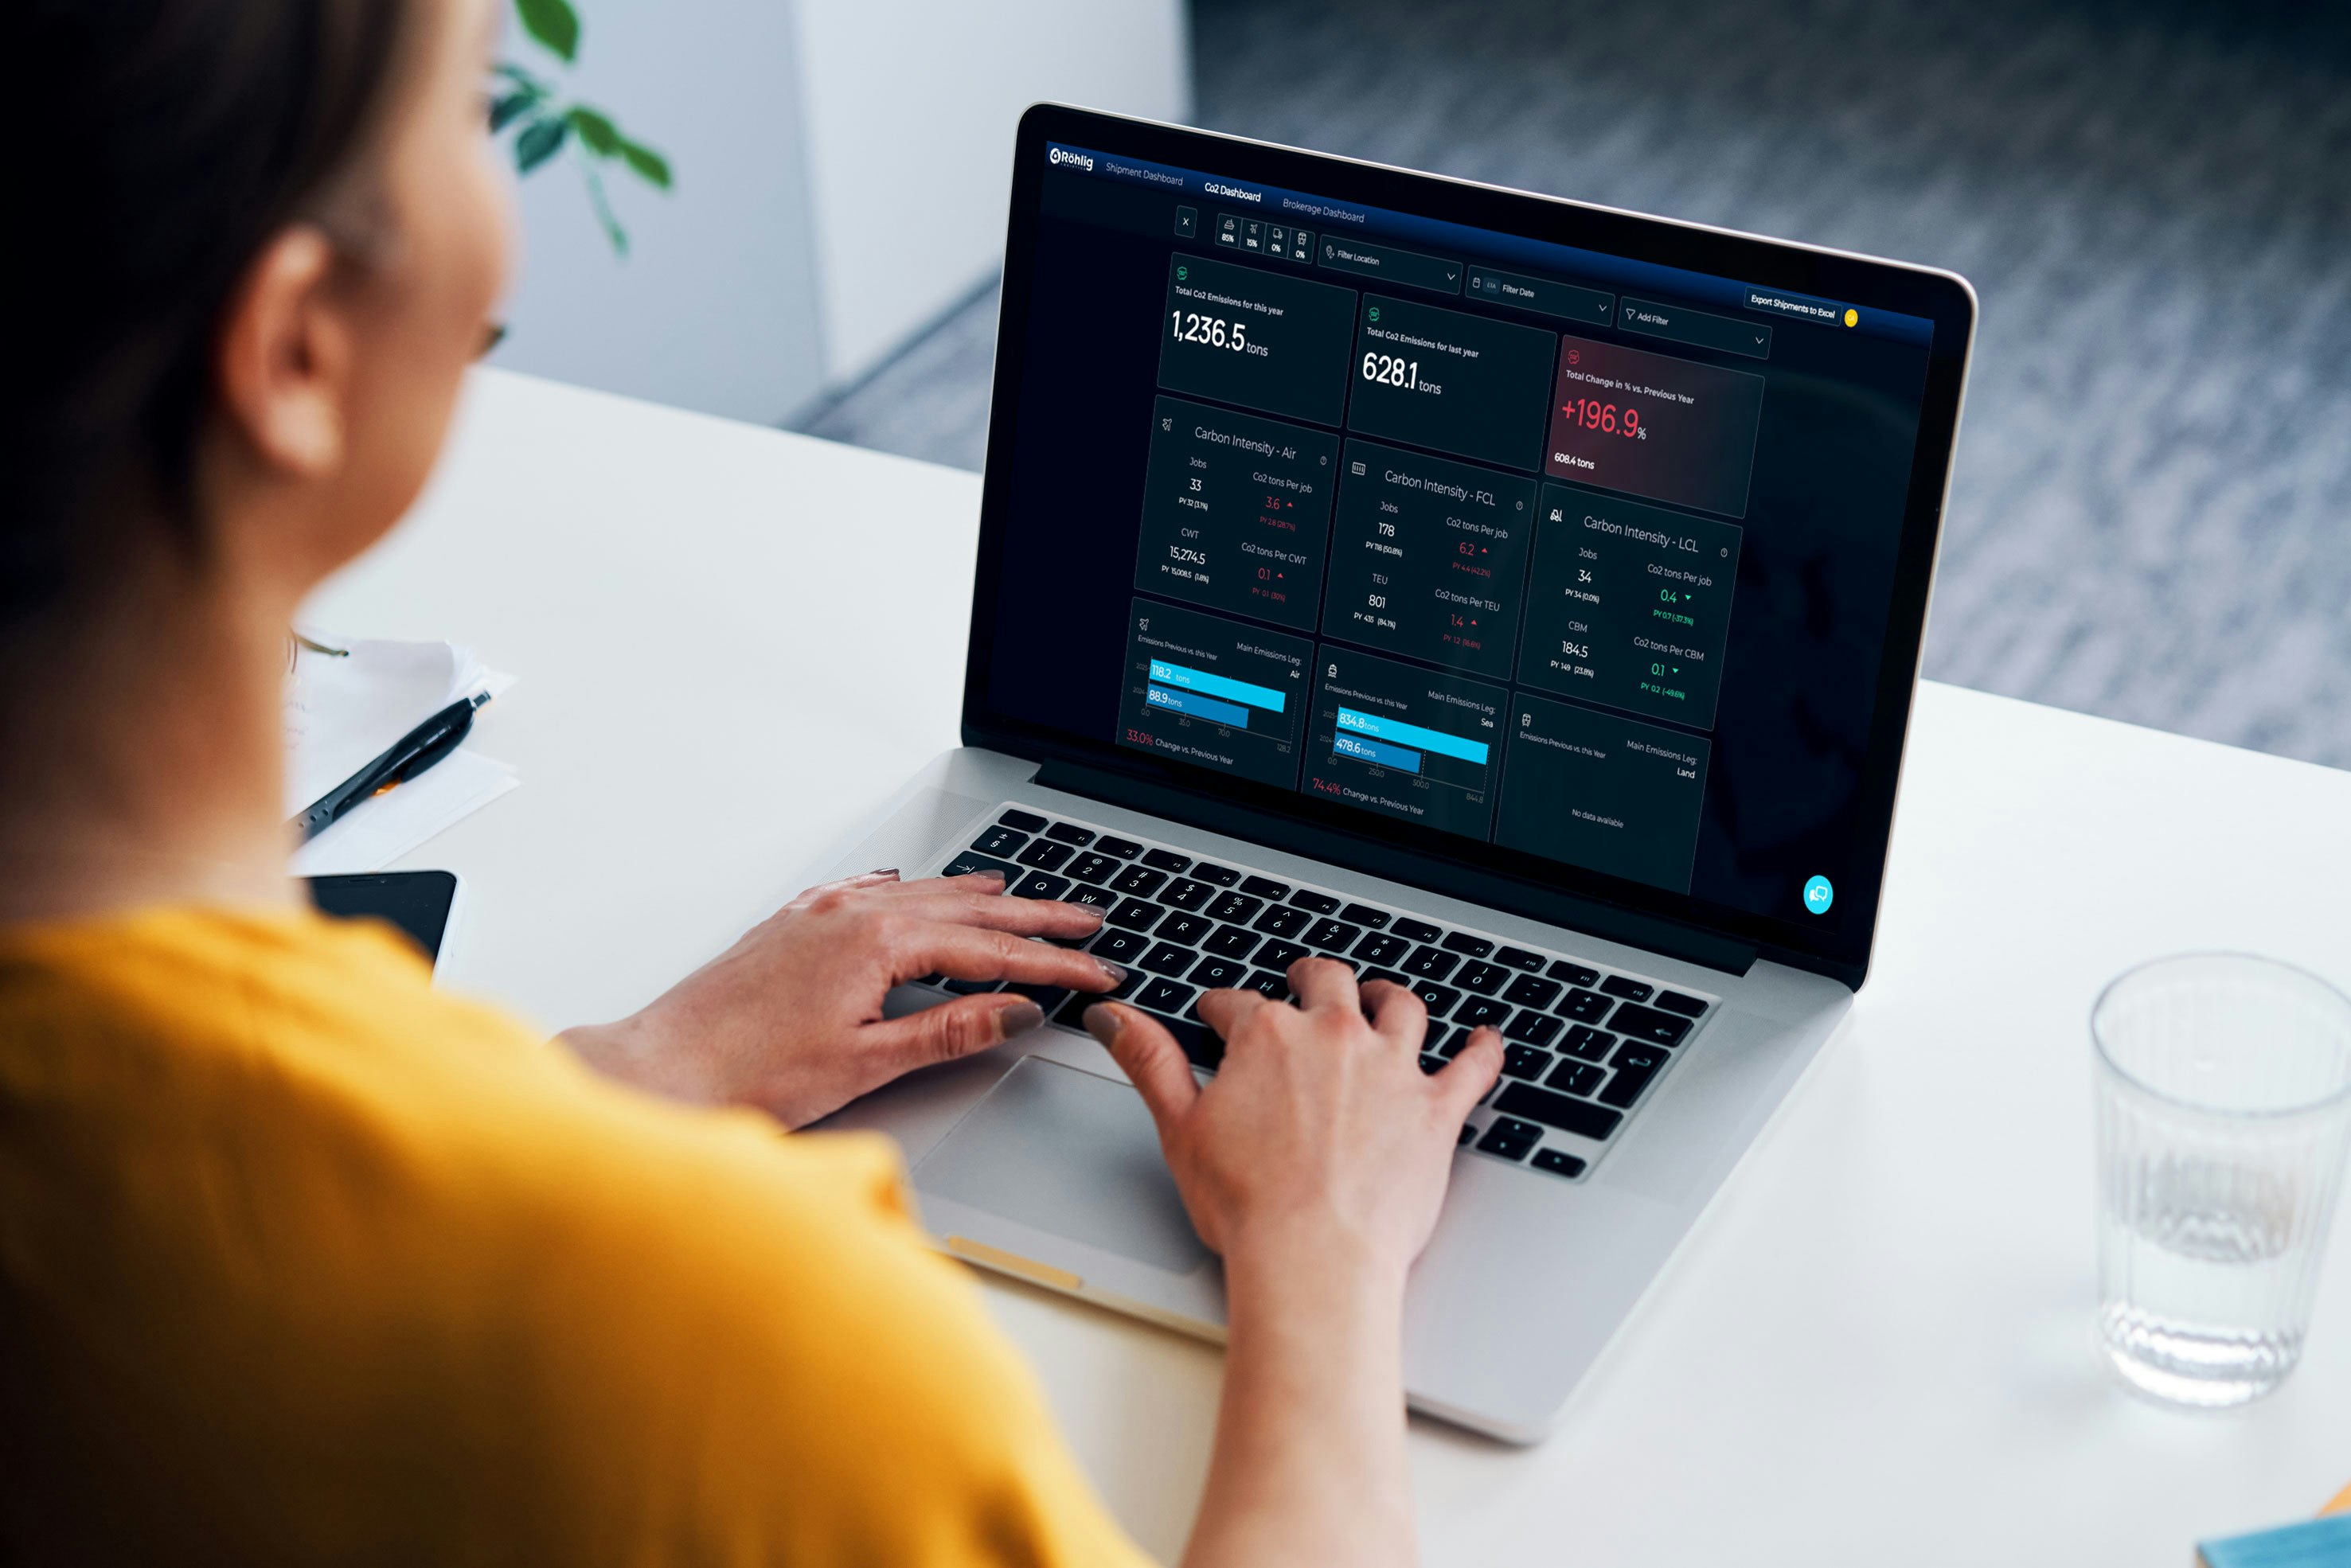
All-new dashboards: Visibility for your emissions and customs brokerage
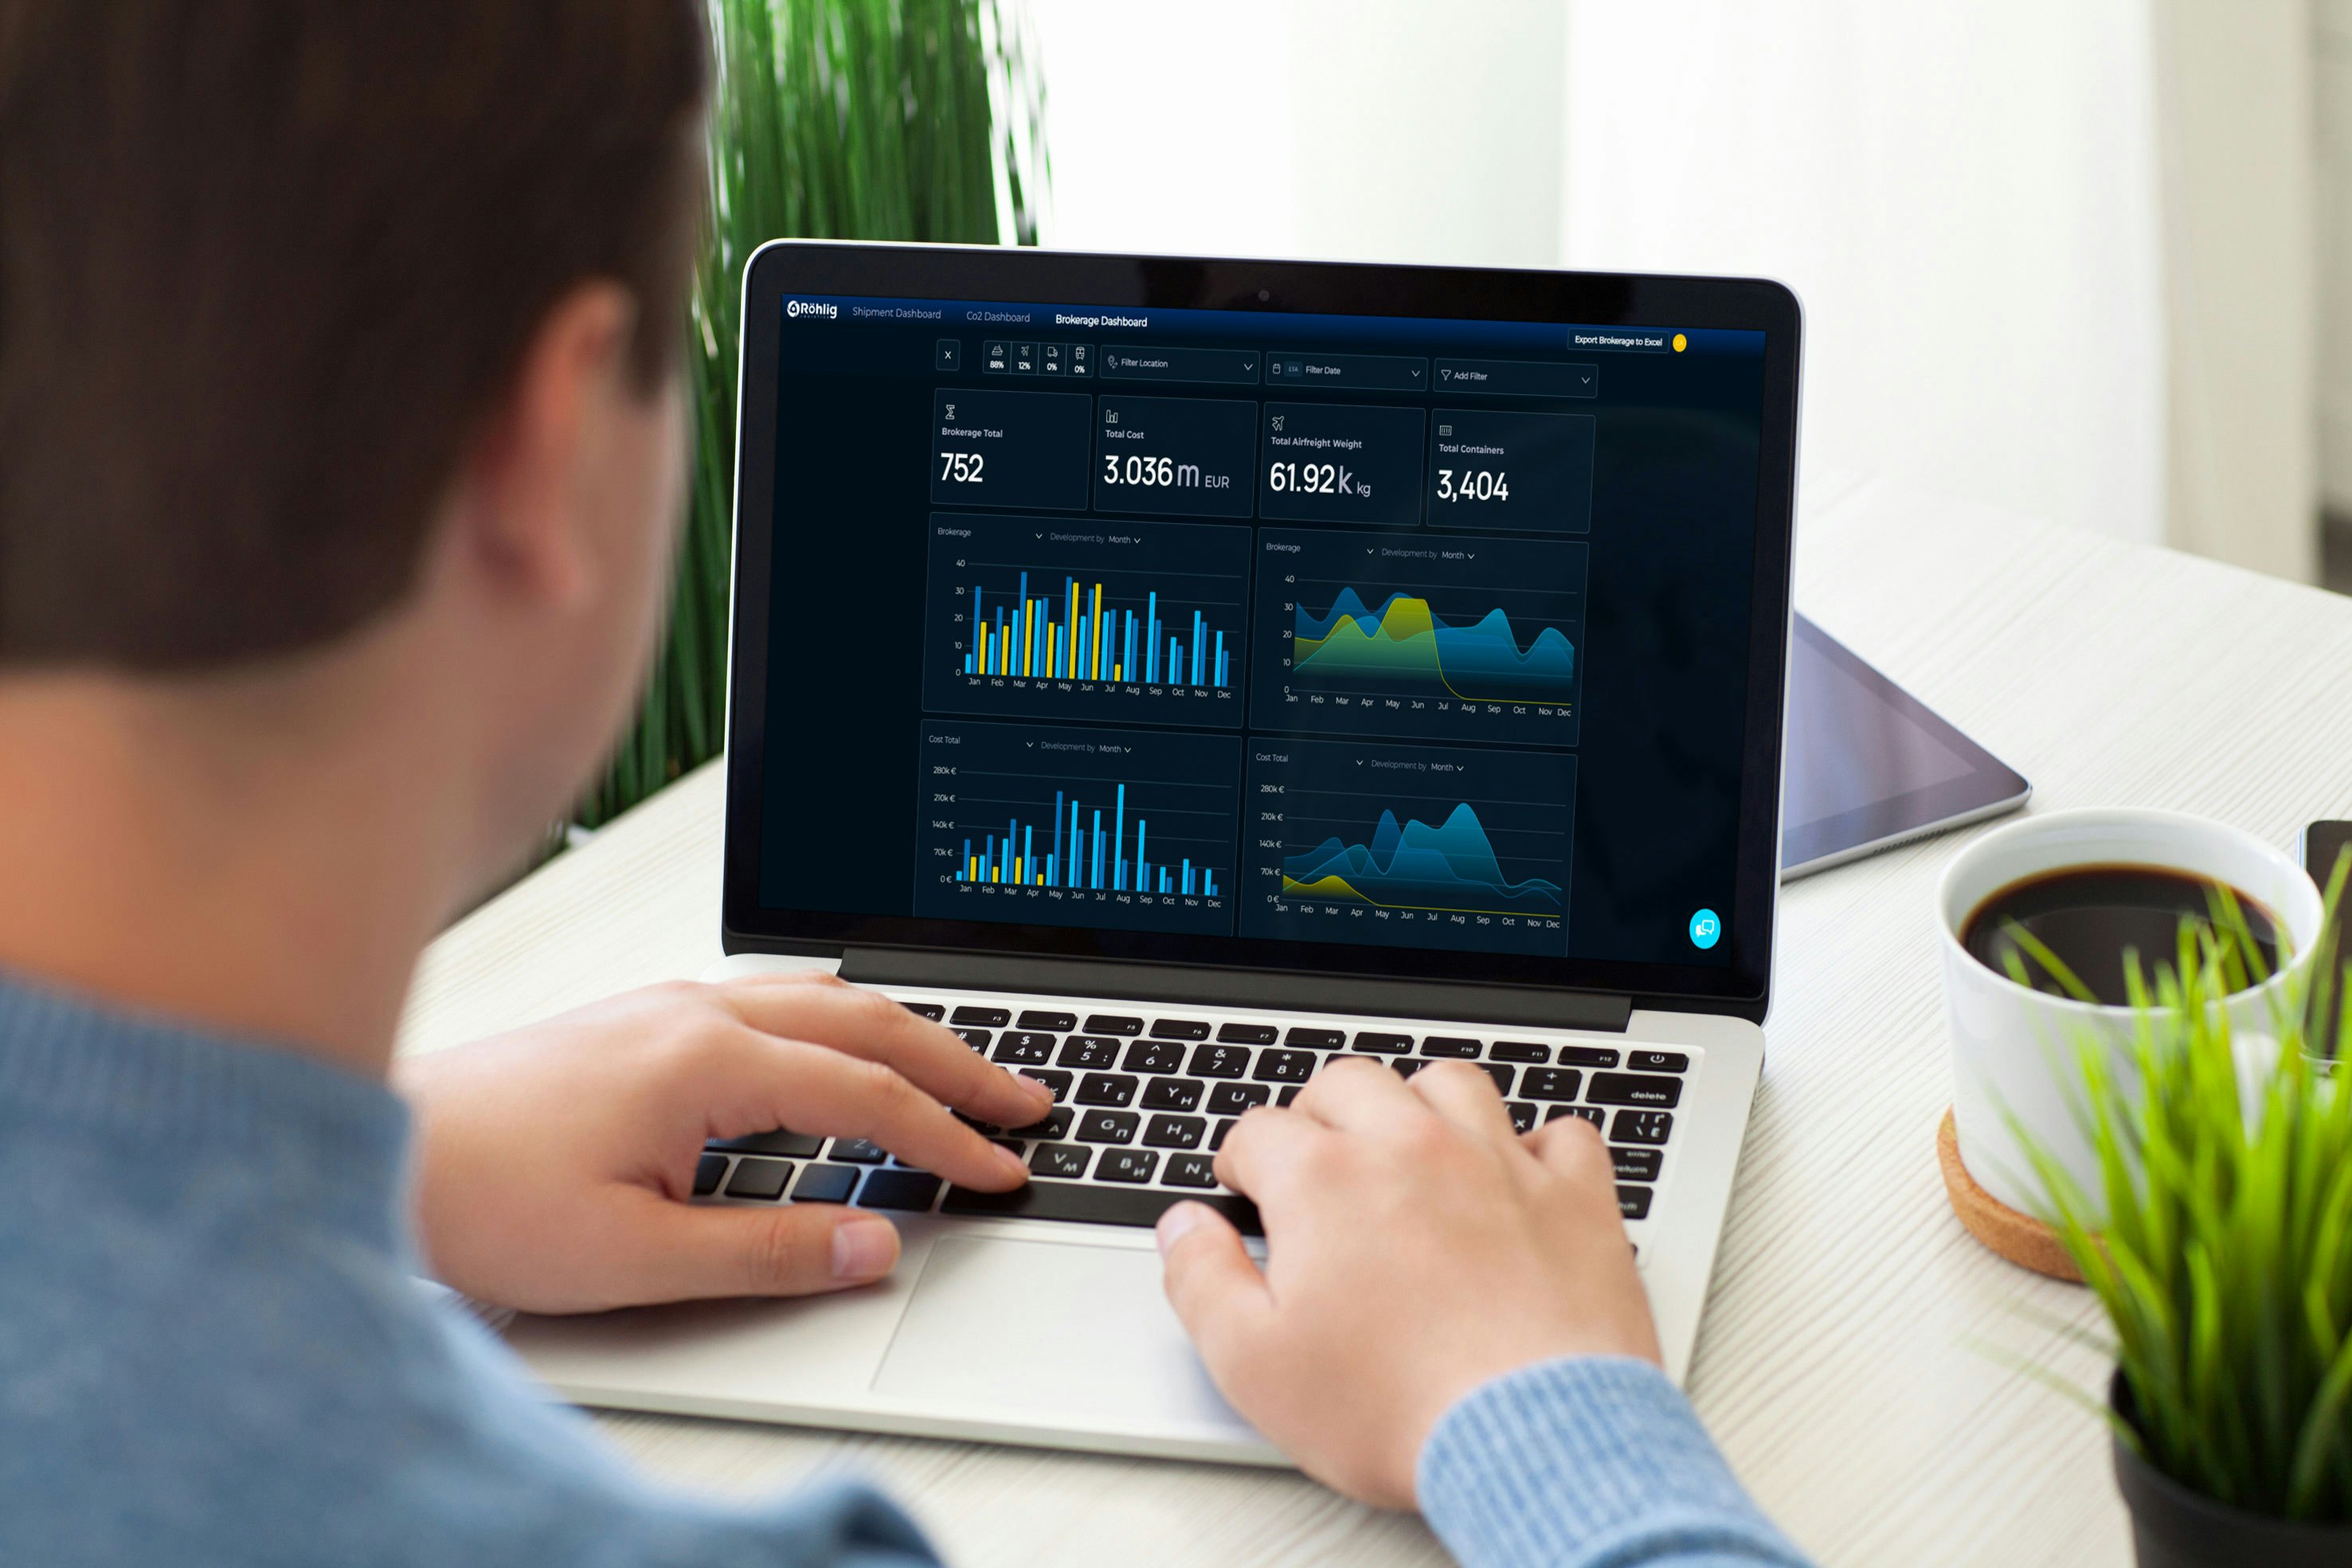
Step into the future of logistics intelligence with Röhlig’s enhanced suite of live, reporting dashboards.
The CO₂ Dashboard empowers you to track freight emissions in real time. Filter by year, mode, or shipment leg, compare per TEU, CBM, or TON (kg), and uncover trends across shippers, consignees, and trade lanes. It’s a powerful tool for teams focused on smarter sustainability and measurable climate impact.
The Brokerage Dashboard brings customs cost visibility into sharp focus. Instantly analyse duty, tax, and clearance costs, identify trends across suppliers and importers, and prep confidently for audits - all in one live, integrated view.
Both dashboards are fast, intuitive, and built to turn real time logistics data into action. With Röhlig Insights, smarter decisions aren’t just possible, they’re built in.
Enhanced user management
Take control of your data security by setting varying user access levels. Customise data views and export permissions based on the needs of your team members, and adjust as your operations develop.
Adapts to your global business
Take out complicated conversions with the choice of over 40 international currencies. Remove clutter from your shipment data and filter by Package Mode, Consignee, Shipper, Carrier, Incoterm and Service Type.
Boost your effiency
Get a streamlined overview of your data all in one place, allowing you to identify areas for optimisation and reduce your overall shipping costs. Data driven decisions start here.
Learn more about Röhlig Insights
Our user-friendly analytics platform
FAQ - Röhlig Insights
Is Röhlig Insights easy to use?
Guided by our straightforward interface, you can navigate Röhlig Insights in just a few clicks. Save time on training with an analytics platform accessible to anyone on your team. From the moment you log in, you can start making data-driven decisions for your business.
What kind of data can I get from Röhlig Insights?
Röhlig Insights goes beyond providing raw data. We've pre-defined KPIs that matter most to your logistics operations. These KPIs allow you to gauge performance, identify trends, and make informed decisions. Whether you're focused on transit times, delivery reliability, or cost analysis, this analytics platform can provide the metrics you need to track and measure success.
How do I start using Röhlig Insights?
Join other Röhlig Logistics customers and take advantage of user-friendly analytics platform to access, analyse, and leverage your air and sea freight shipment information. Whether using historical or current data, you can be sure that you’re making evidence-based decisions going forward.
Get instant KPIs and analytics data